How to navigate Guru Analytics
Analytics in Guru help you measure your team's performance and evaluate the impact of Guru across your organization. Learn how to access dashboards, interpret results, download reports, and schedule recurring analytics exports.
Track your team's knowledge management performance and make data-driven decisions with Guru's analytics dashboards. Measure adoption, monitor verification health, and understand how your team uses knowledge across Cards, Collections, Knowledge Agents, and more.
Access Required
Your permissions...
You can view analytics for...
Admin role
• Everything across your entire workspace
Edit access to at least one Collection as Owner, Author, or Editor)
• All Cards you can access across any Collection
• Cards & Collections dashboard
• Adoption and Users & Groups dashboardsOwn specific Pages
• Only the Pages you own
• Adoption and Users & Groups dashboardsOwn specific Knowledge Agents
• Only the Knowledge Agents you own
• Adoption and Users & Groups dashboardsViewer access everywhere
• No analytics access
Accessing analytics
- Select Analytics from the left sidebar.
- Choose the analytics dashboard you want to view.
Exporting analytics data
Export your analytics data in multiple formats for presentations, reports, or deeper analysis.
Export a single dashboard
- Open the dashboard you want to export.
- Filter down the relevant data you want to export.
- Select the ellipses in the upper right corner of each chart. Then select export.
- Under Destination, choose where you want the export delivered: • Download • Email • Webhook • Cloud storage
- To download the content to your computer:
- Choose your export format: csv, excel, pdf, json.
- To send yourself the download:
- Select Send.
- Select the envelope icon in the top right corner of the module.
- Customize the recipients and message.
Set up scheduled exports
Send analytics reports automatically to your team on a regular schedule.
- Open the dashboard you want to schedule.
- Select the Ellipses, then Export, then Schedule. You can also get here by selecting Alert When from the ellipses menu.
- Select your recipients and the custom message attached to the scheduled export.
- You can also add additional charts from the same dashboard to the scheduled export. It is not possible to attach multiple charts from different dashboards to one scheduled export.
- Configure your schedule:
- Choose frequency (daily, weekly, monthly)
- Set delivery time
- Either opt to send that scheduled report on that cadence, or add additional conditions.
- For example, only send a report on verification weekly, if the trust score has dipped below 80%.
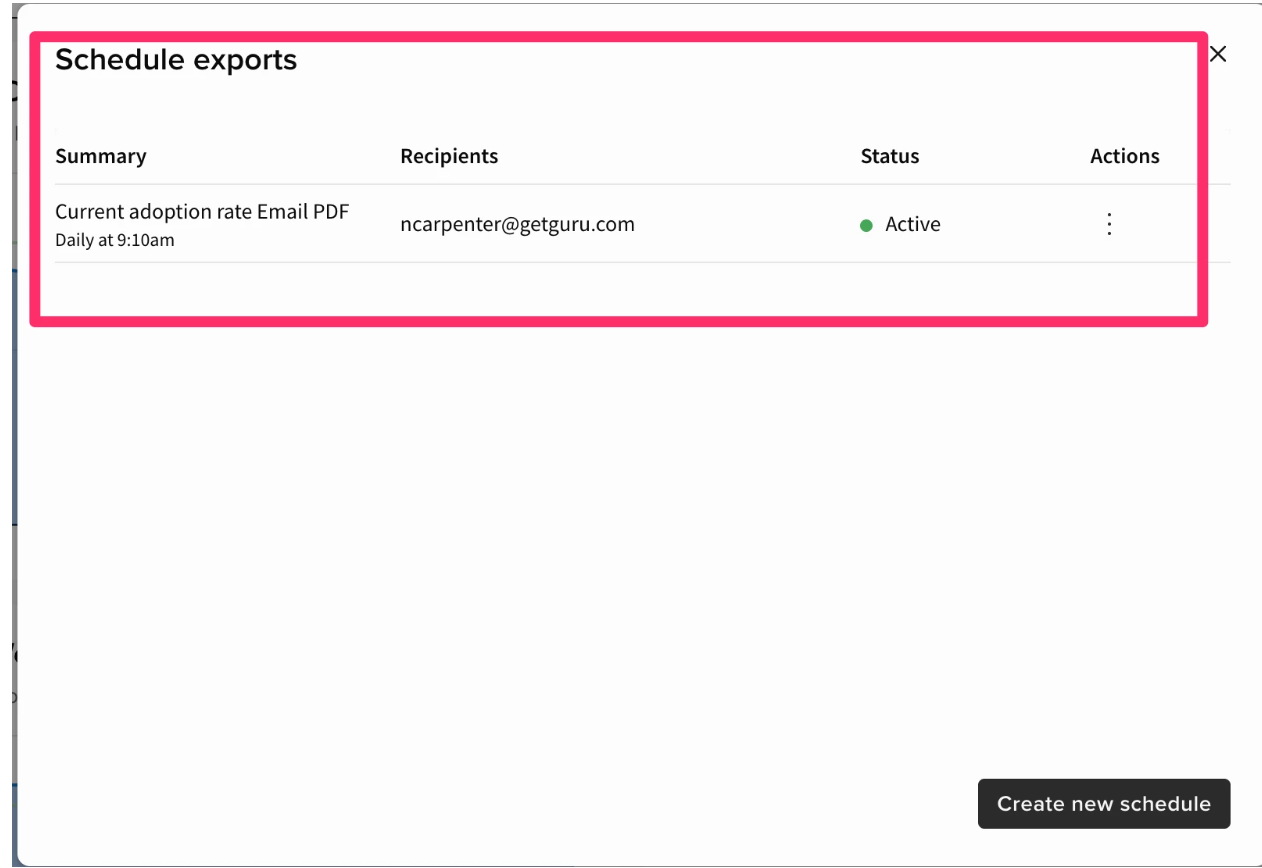
Editing or deleting scheduled exports
- Open the dashboard you want to manage the scheduled export for.
- Select the Ellipses, then Export, then Schedule. You can also get here by selecting Alert When from the ellipses menu.
- When you get to the next page, click Cancel instead of Create.
- It will bring you to this screen where you can edit or delete existing scheduled exports.
Frequently asked questions
Can I share analytics with stakeholders outside my workspace?
Yes, export dashboards to PDF or schedule reports to email addresses, even for users without Guru accounts.
How long does it take for analytics to refresh?
It typically takes analytics around 4-5 hours to refresh.
Can I disable Analytics?
Admins and relevant custom roles can hide Analytics from users under Manage > Workspace Preferences
How far back does Analytics data go?
Guru analytics go back one year. For any research needed across data prior to one year, you can use the Card Manager or API.
My analytics aren't loading, I just see a blank page. Why is this?
If analytics data is not displaying correctly, the most common cause is ad blocker interference. Many ad blockers use generic rules that can block Guru's analytics API calls, particularly those matching the pattern ://analytics./event. To resolve this issue, check if you have any ad blocking extensions enabled and add Guru to your whitelist. If you're in an organization, contact your IT team as ad blocking software may be installed at the network level. After whitelisting Guru, refresh your browser to see if analytics data begins appearing correctly.
Why am I seeing duplicate listings on certain dashboards?
Guru reports will default to filter by the All Members Group, to show actions across the organization. If you add multiple group filters, be advised that this may end up reflecting duplicate entries in the dashboard. The reporting evaluates questions/answers for each group separately and then combines them to produce the final result.